Why sample size matters
 Many experiments and clinical trials are run with too few subjects. An underpowered study is wasted effort if even substantial treatment effects go undetected. When planning a study, therefore, you need to choose an appropriate sample size. Your decision depends upon a number of factors including, how scattered you expect your data to be, how willing you are to risk mistakenly finding a difference by chance, and how sure you must be that your study will detect a difference, if it exists.
StatMate shows you the tradeoffs
Some programs ask how much statistical power you desire and how large an effect you are looking for and then tell you what sample size you should use. The problem with this approach is that often you can't really know this in advance. You want to design a study with very high power to detect very small effects and with a very strict definition of statistical significance. But doing so requires lots of subjects, more than you can afford. StatMate 2 shows you the possibilities and helps you to understand the tradeoffs in terms of risk and cost so you can make sound sample-size and power decisions.
What about power?
You also need to know if your completed experiments have enough power. If an analysis results in a "statistically significant" conclusion, it's pretty easy to interpret. But interpreting "not statistically significant" results is more difficult. Its never possible to prove that a treatment had zero effect, because tiny differences may go undetected. StatMate shows you the power of your experiment to detect various hypothetical differences.
Introduction
It is easiest to understand sample size calculations in the context of an example. The example we'll use is a project I worked on twenty years ago. We didn't really do a formal analysis of sample size back then, but should have. Then in the next example, we'll use a power analysis to help understand the results we actually obtained. Learn the basic principles of sample size calculations.
Note: Using StatMate is entirely self-explanatory, and this example emphasizes the logic behind sample size calculations rather than the mechanics of using StatMate.
First a bit of background. Platelets (the small cells in blood that help with clotting) have alpha2-adrenergic receptors. Epinephrine (adrenaline) in the blood binds to these receptors, which make the platelets more sticky, so they aggregate, helping blood clot. Hypertension (high blood pressure) is a complicated disease (or group of diseases) but there is lots of evidence that the adrenergic signalling system might be abnormal in hypertension.
We were most interested in the heart, blood vessels, kidney and brain but obviously couldn't access those tissues in people. Instead, we decided to count the number of alpha2-adrenergic receptors on platelets, and compare people with and without hypertension.
How many subjects should we use? When we did this study more than 25 years ago, we picked sample size more-or-less at whim. But we should have done a proper sample size analysis. In the next few screens, I'll show you how to do so with StatMate.
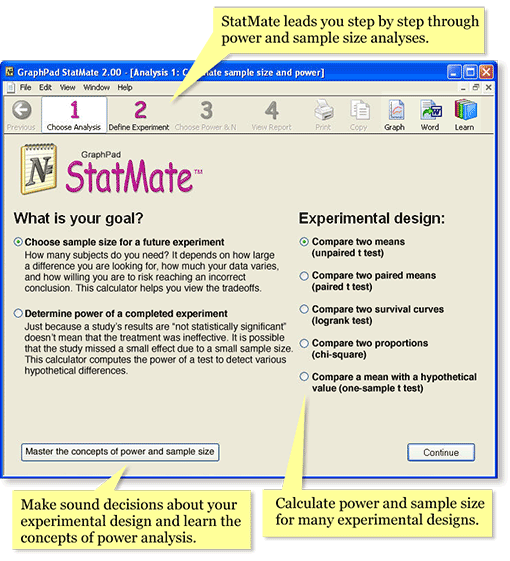
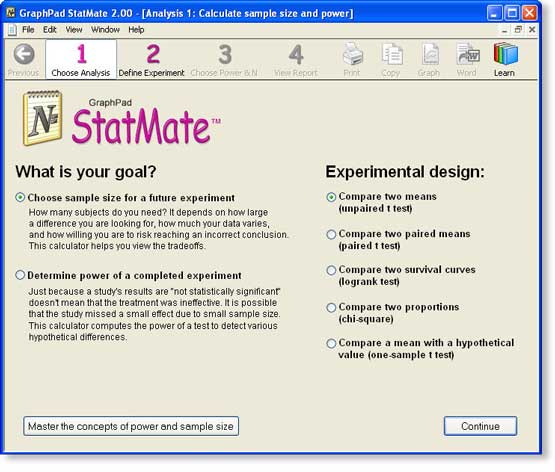
Step 1: Choose analysis
In step 1, choose the kind of analysis you want StatMate to perform by answering two questions:
- What is your goal? For this example, we want to compute sample size for a new study. Later, we'll go through an example of determining the power of a completed experiment.
- What is your experimental design? In this example, we plan to compare the mean of two groups using an unpaired t test.
Step 2: Estimate the SD
On step 2, StatMate asks us to enter the standard deviation (SD) we expect to see.
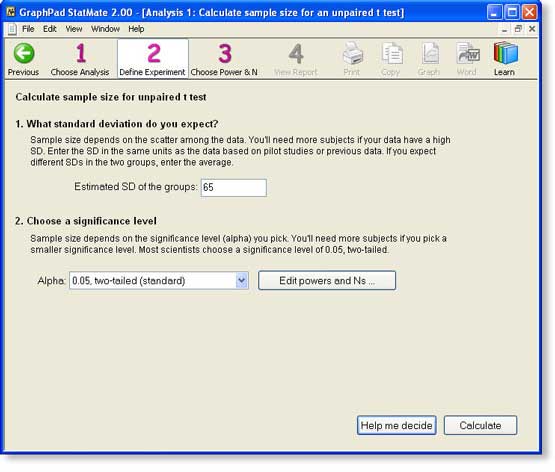
If you expect to see a lot of scatter among values (high SD), then you'll need a large sample size. On the other hand, if you expect to see very little scatter among the values (low SD), you won't need so many subjects. There simply is no way to estimate the sample size you need unless you can estimate the amount of scatter you expect to see.
For this example, we use data from other studies of plaelet alpha2-adrenergic receptors done for different reasons. These studies show that the average number of receptors per platelet is about 250 and the standard deviation is about 65. Why so high? It probably is a combination of biological variation, experimental error in counting the receptors, and experimental error in counting the platelets. Using a prior study to obtain an SD value is usually better than using a pilot study.
Choose a significance level
StatMate next asks you to choose a significance level, alpha. This is the P value below which you deem results "statistically significant" and thus reject the null hypothesis.
Ideally, you should set a value for a based on the consequence of making a Type I error (concluding that a difference is statistically significant when in fact the treatment is ineffective and the difference was due to random variation). If the consequences of making a Type I error are serious, set a to a smaller value, and you'll need more subjects. If the consequences of a Type I error are minor, set a to a higher value so you can get by with fewer subjects.
Most investigators always set alpha to 0.05, two-tailed, and we'll do the same. Note: The button "Edit powers and Ns..." gives you a chance to revise the list of powers and sample sizes used on the next screen. In almost all cases, the defaults will be just fine and we'll keep the defaults for this example.
Step 3: View tradeoff of sample size and power
Some programs would ask you at this point how much statistical power you desire and how large an effect size you are looking for. The program would then tell you what sample size you need. The problem with this approach is that you often can't say how much power you want, or how large an effect size you are looking for. You want to design a study with very high power to detect very small effects, with a very strict definition of statistical significance. But doing so requires lots of subjects, more than you can afford. What you need to do is review the possibilities, and understand the tradeoffs.
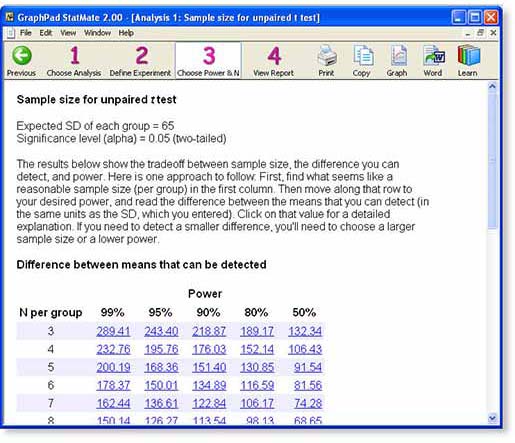
StatMate presents a table showing the tradeoff between sample size, power, and the effect size that you will be able to detect as statistically significant.
The table presents lots of information.
Each row in the table represents a potential sample size you could choose. The numbers refer to the sample size in each group.
Each column represents a different power. The power of a study is the answer to this question: If the true difference between means equals the tabulated value, what is the chance that an experiment of the specified sample size would result in a P value less than 0.05, our choice for alpha in this example, and thus be deemed "statistically significant". You can change the list of powers used by clicking "Edit Powers and Ns..." in step 2.
Since this example is for a unpaired t test, each value in the table is a difference between the means of the two groups, expressed in the same units as the SD you entered on step 2. In this example, the data are expressed as number of receptors per platelet.
Now comes the hard part.
You need to look over this table and find a satisfactory combination of sample size, power, and a difference you can detect. Next we will outline three approaches A, B and C.
Approach A.
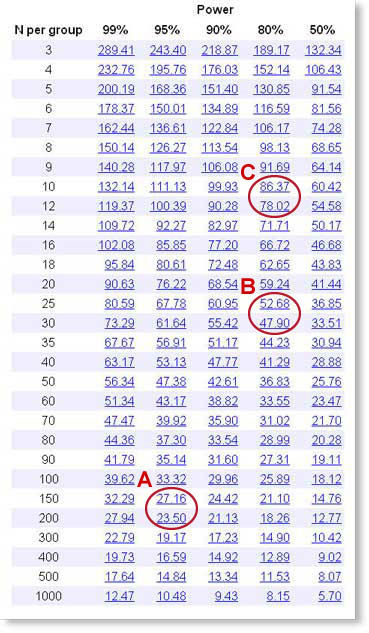
In this approach, we want to plan a fairly definitive study and have plenty of time and funding.
What power should we use? We chose the traditional significance level of 5%. That means that if there truly is no difference in mean receptor number between the two groups, there still is a 5% probability that we'll happen to get such a large difference between the two groups that we'll end up calling the difference statistically significant. We also want a 5% probability of missing a true difference. So we'll set the power equal to 100%-5%, or 95%.
What size difference are we looking for? While we haven't yet studied people with hypertension, we know that other studies have found that the average number of receptors per platelet is about 250. How large a difference would we care about? Let's say we want to find a 10% difference, so a difference between means of 25 receptors per cell.
Look down the 95% power column, to find values near 25. This value is about half way between N=150 and N=200, so we need about 175 subjects in each group.
That is a lot of subjects. Approach B shows an approach that justifies fewer subjects.
Approach B.
In this approach, we want a smaller sample size, and are willing to make compromises for it.
What power should we use? It is pretty conventional to use 80% power. This means that if there really is a difference of the tabulated size, there is a 80% chance that we'll obtain a "statistically significant" result (P<0.05) when we run the study, leaving a 20% chance of missing a real difference of that size.
What size difference are we looking for? While we haven't yet studied people with hypertension, we know that other studies have found that the average number of receptors per platelet is about 250. How large a difference would we care about? In approach A, we looked for a 10% difference. Let's look instead for a 20% difference, so a difference between means of 50 receptors per cell.
Look down the 80% power column, to find values near 50. This value is about half way between N=25 and N=30, so we need about 28 subjects in each group.
That still seems like a lot. Can we justify even fewer?
Approach C.
Let's say that our budget (or patience) only lets us do a study with 11 subjects in each group. How much information can we obtain? Is such a study worth doing?
With a small study, we know we are going to have to make do with a moderate amount of power. But the rightmost column is for a power of only 50%. That means that even if the true effect is what we hypothesize, there is only a 50% chance of getting a "statistically significant" result. In that case, what's the point of doing the experiment? We want more power than that, but know we can't have a huge amount of power without a large sample size. So let's pick 80% power, which is pretty conventional. This means that if there really is a difference of the tabulated size, there is a 80% chance that we'll obtain a "statistically significant" result (P<0.05) when we run the study, leaving a 20% chance of missing a real difference.
If we look down the 80% power column, in the N=11 row, we find that we can detect a difference of 86.4. We already know that the mean number of alpha2-adrenergic receptors is about 250, so a sample size of 12 in each group has 80% power to detect a 35% (86.4/250) change in receptor number.
This sample size analysis has helped us figure out what we can hope to learn given the sample size we already chose. Now we can decide whether the experiment is even worth doing. Different people would decide this differently. But some would conclude much smaller differences might be biologically important, and that if we can only detect a huge change of 35%, and even that with only 80% power, it simply isn't even worth doing the experiment.
How can all three approaches be correct?
If you specify exactly what power you want, and how large an effect you want to detect, StatMate can tell you exactly how many subjects you need.
But generally, you won't be sure about what power you want (or are willing to accept) or how large an effect you want to detect. Therefore, you can justify almost any sample size. It depends on how large a effect you want to find, how sure you want to be to find it (power), and how willing you are to mistakenly find a significant difference (alpha). So there is no one right answer. It depends on why you are looking for a difference and on the cost, hassle and risk of doing the experiment.
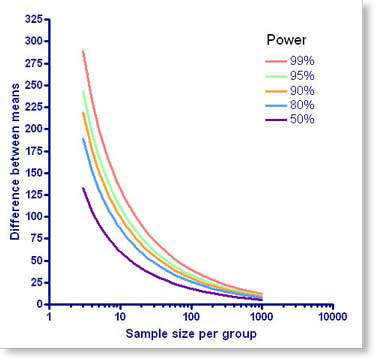
Graph the relationship between N and power
StatMate does not create graphs itself. But if you own a copy of GraphPad Prism version 4.01 (Windows) or 4.0b (Mac) or later, just click the graph button to make an instant graph in Prism. Each curve is for a different power, and shows the relationship between the sample size you could choose for each group (X) and the difference you would then detect as "significant" (Y).
As you go from left to right, the curves go down. This makes sense - if you use more subjects (collect more data), then you'll be able to reliably detect smaller differences. Each curve is for a different power. If you choose a higher power, the curve shifts to the right. This also makes sense - if you want more power (to have less chance of missing a real difference), then you'll need more subjects.
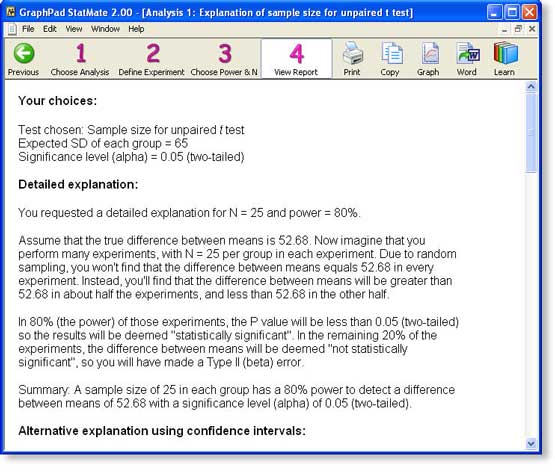
Step 4: View StatMate's report
We'll choose the sample size chosen in approach B. In step 3 of StatMate, each value is a link. We click the link in the 80% power column and the N=25 row (52.68), and StatMate presents a complete report.
The screen shot below shows the first two of four sections of the report: a reiteration of your choices, and a detailed interpretation. The report then shows the entire table of tradeoffs (which you have already seen) and a discussion of when it makes sense to design studies with unequal sample sizes.
You may view the entire report for this example as a pdf file. You can send the entire report to Word with a click of a button (Windows only), or via copy and paste.
Introduction
Using StatMate is entirely self-explanatory, and this example discusses the logic behind power analysis more than the mechanics of using StatMate. Learn the basic concepts of statistical power.
We will continue analyzing the experiment discussed in the sample size example (Clinical Science 64:265-272, 1983). Now we'll use power analysis to interpret the results.
We determined the number of alpha2-adrenergic receptors on platelets of people with and without hypertension. Here are the results:
Controls Hypertensives
| Number of subjects |
17 |
18 |
| Mean receptor number (receptors/platelet) |
263 |
257 |
| Standard Deviation |
87 |
59 |
The data was analyzed with an unpaired t test. Here are the results from Prism:
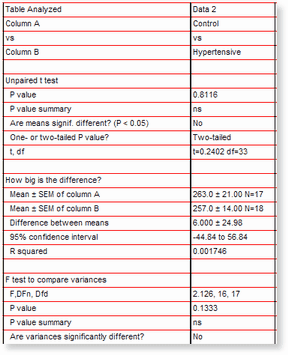
Because the mean receptor number was almost the same in the two groups, the P value is very high. These data provide no evidence that the mean receptor number differs in the two groups.
While it is tempting to just stop with the conclusion that the results are “not statistically significant� (as we did in this study published more than 25 years ago), there are two ways to go further. One approach is to interpret the confidence interval. But here we'll use power analysis to evaluate the experiment.
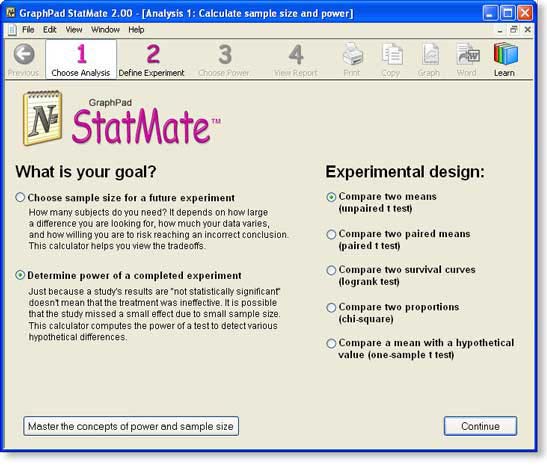
Step 1: Choose analysis
Choose the kind of analysis you want StatMate to perform by answering two questions:
- What is your goal? For this example, we want to determine the power of a completed experiment.
- What is your experimental design? In this example, we plan to compare the mean of two groups using an unpaired t test.
Step 2: Enter SD and N for each group
Enter the results of the study.
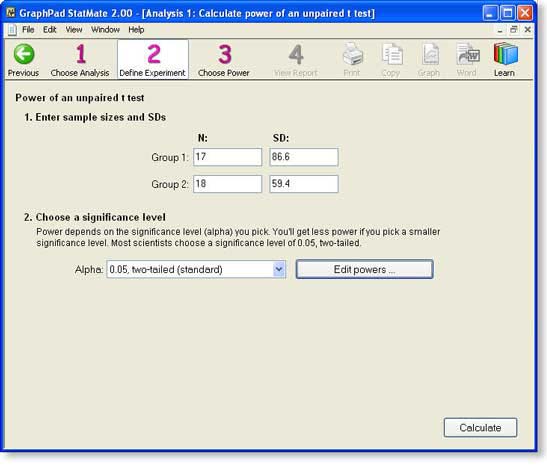
Note that you do not need to enter the mean of the two groups. Mean values are not needed for power calculations. You need only enter the size and variability of the groups.
Step 3: Choose power
StatMate shows us the power of the study (given the sample sizes and standard deviations you entered) to detect various hypothetical differences (delta).
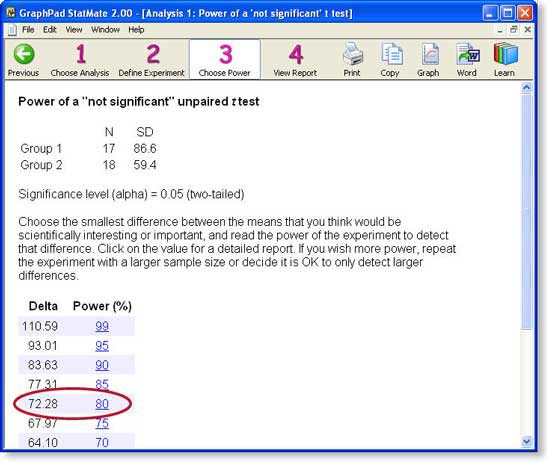
Click the result with a power of 80%.
Step 4: View StatMate's report of power analysis
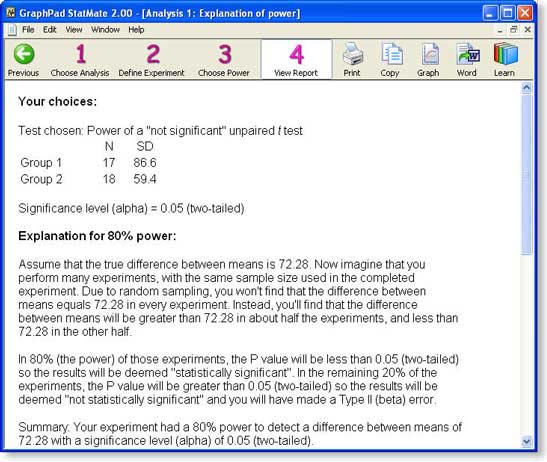
The screen shot above shows the first two of three sections of the report: a reiteration of your choices, and a detailed interpretation. The report then shows the entire table of tradeoffs (which you have already seen). You can export the report to Word by clicking one button (Windows only) or via copy and paste.
StatMate features
Calculate sample size - How many subjects (data points) do you need? Naturally, the answer is "it depends". It depends on how large a difference you are looking for, how much your data vary, and on how willing you are to risk mistakenly finding a difference by chance or mistakenly missing a real difference. StatMate helps you see the tradeoffs, so you can pick an appropriate sample size for your experiment.
Calculate power - Just because a study reaches a conclusion that the results are "not statistically significant" doesn't mean that the treatment was ineffective. It is possible that the study missed a small effect due to small sample size and/or large scatter. StatMate calculates the power of a test to detect various hypothetical differences.
Choose from these experimental designs:
- Compare two means (unpaired t test)
- Compare two paired means (paired t test)
- Compare two survival curves (logrank test)
- Compare two proportions (chi-square test)
- Compare a mean with a hypothetical value (one-sample t test)
StatMate is available for Windows only
System requirements Windows: Windows 98 and up and 2 MB of free space.